


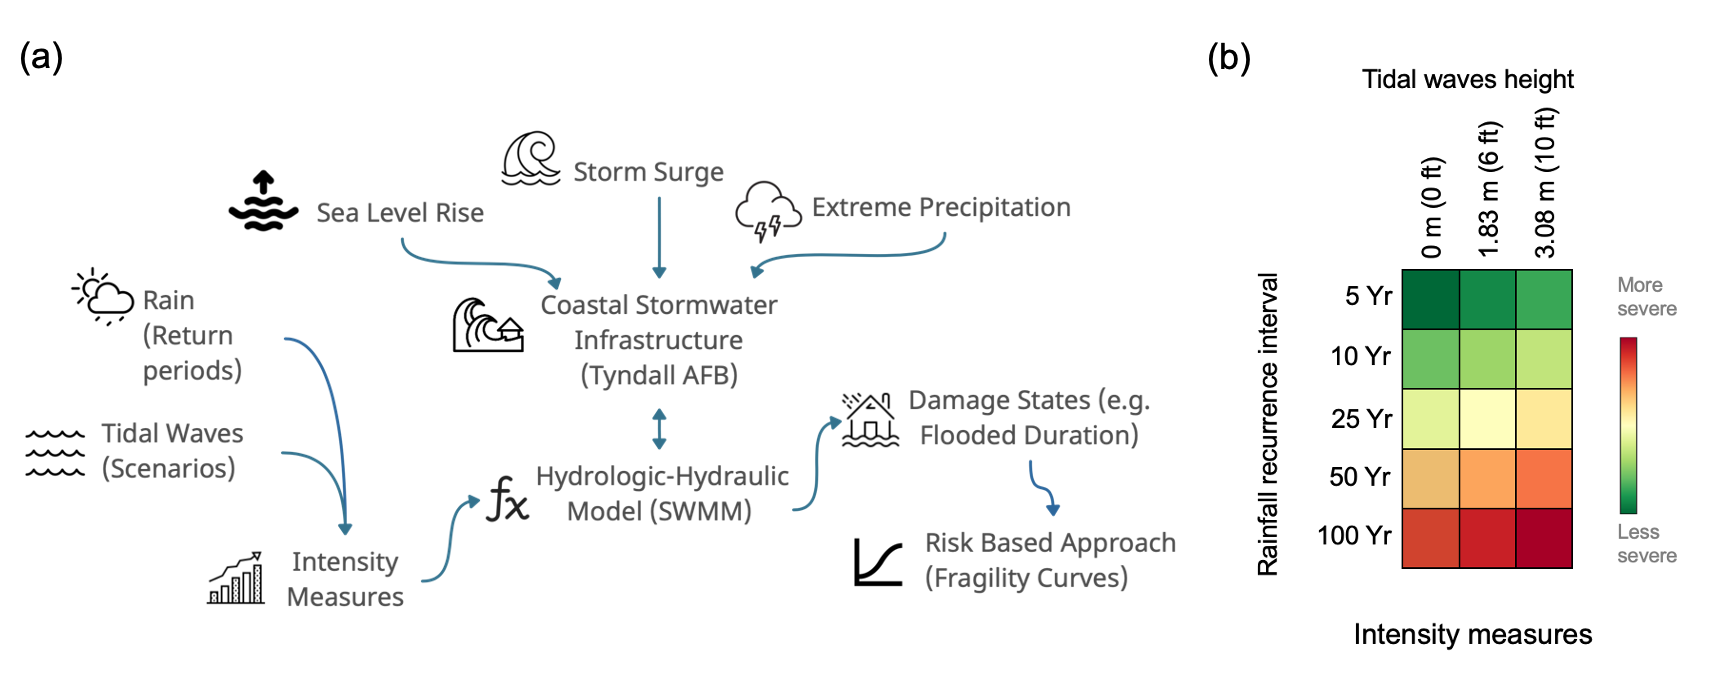
Fragility curves describe the likelihood that a system, asset, or component in an engineered system will exceed a specific damage state under a given intensity measure. Intensity measures refer to environmental hazards or combinations of hazards affecting infrastructure, such as heavy rainfall or storm surge. Damage states are typically categorized discretely, indicating levels of functional loss or structural damage, from partial impairment to complete collapse. Fragility curves are widely used in vulnerability and reliability studies of civil infrastructure, including bridges, buildings, pipelines, and water distribution systems. In a study by Shrestha and Chini (2025), fragility curves were developed for critical stormwater infrastructure systems in an urbanized coastal catchment to assess resilience under compounding flood effects from heavy rainfall and high tides. Such fragility curves support evaluating infrastructure systems' vulnerability and guide the design, management, and investment decisions for resilient infrastructure.
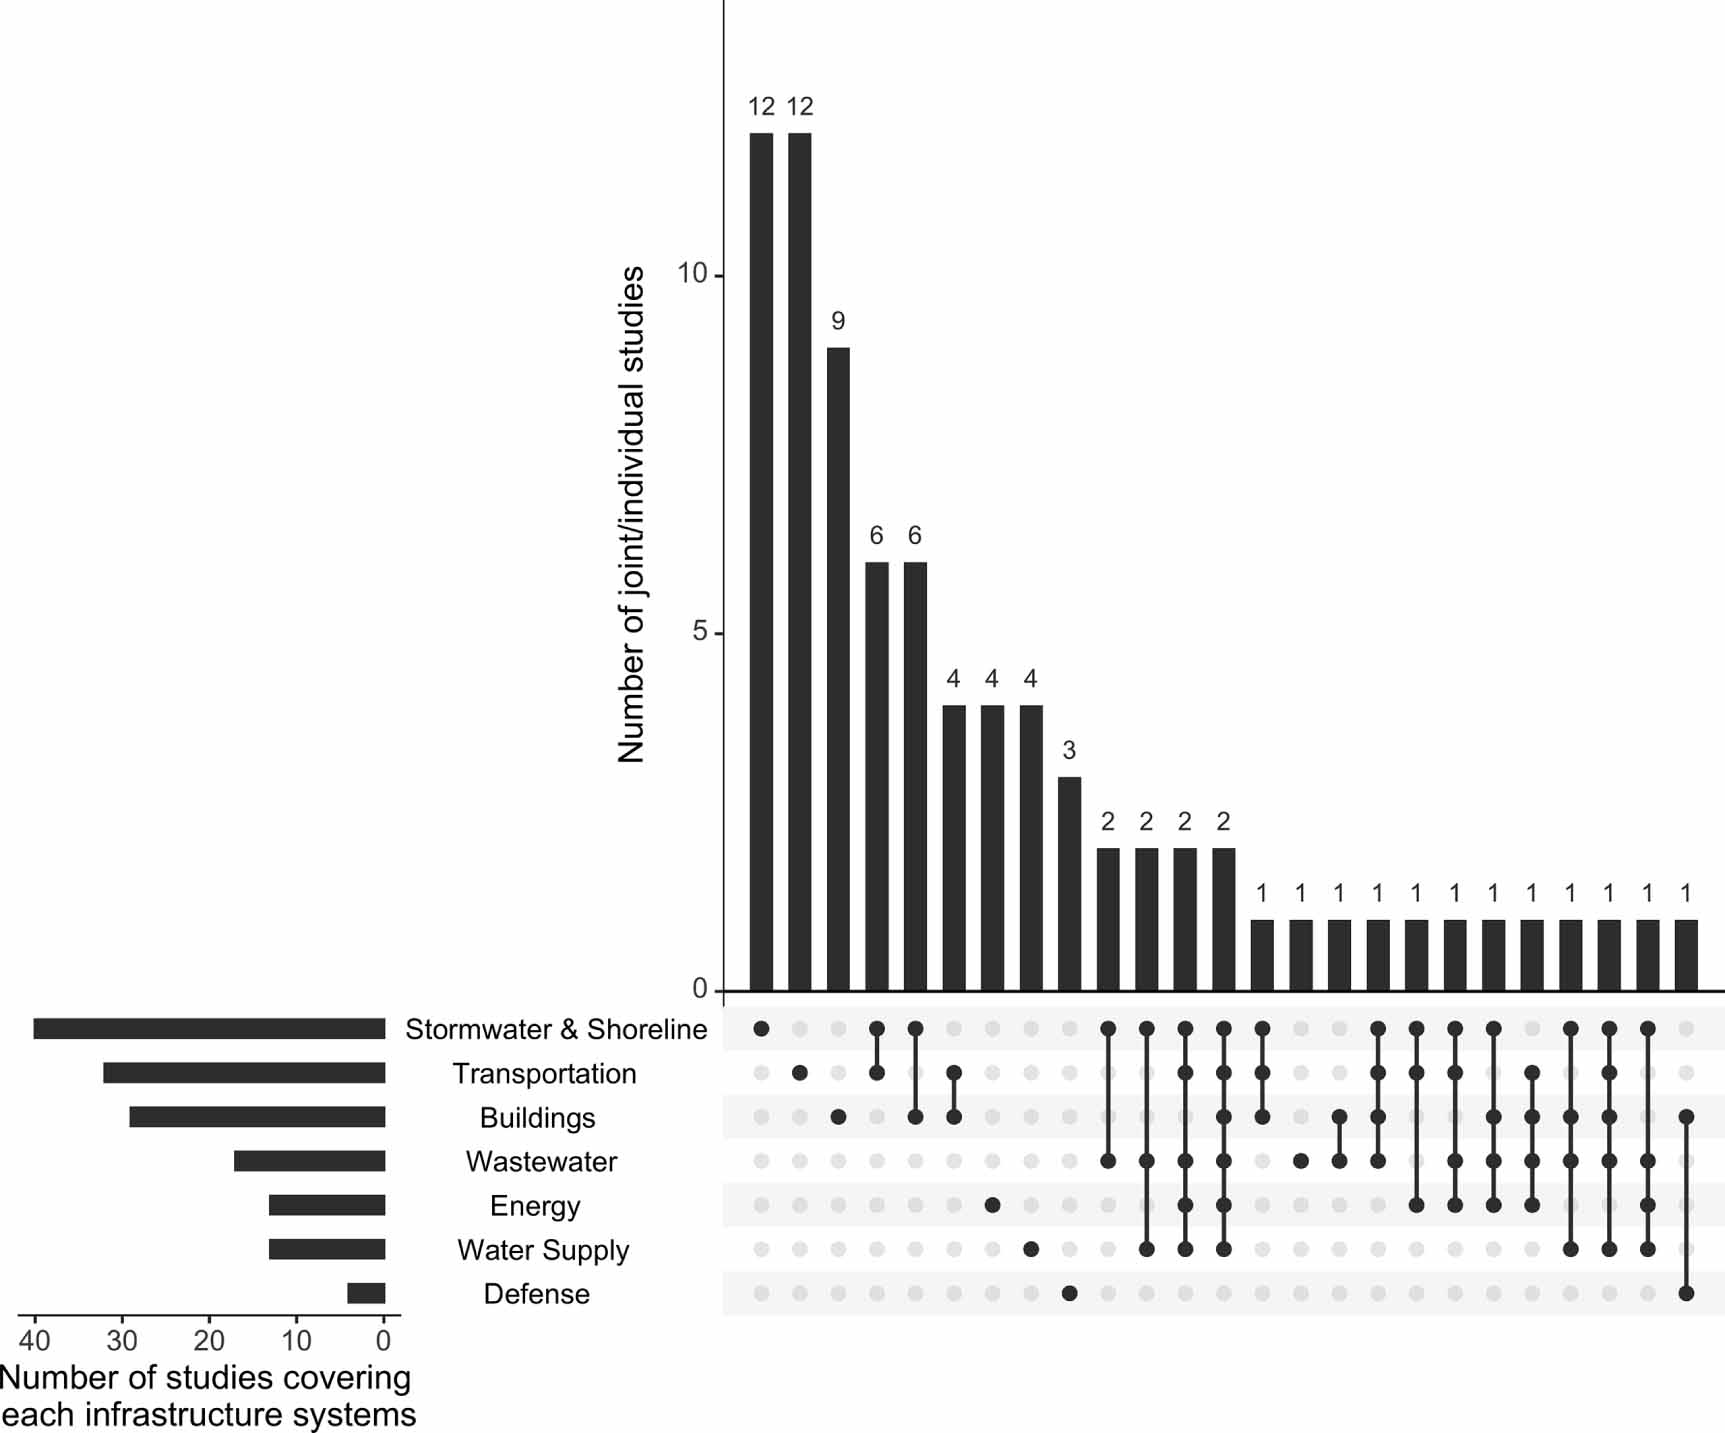
Adapting interdependent coastal infrastructure systems is critical for enhancing systems resilience against climate change, potentially avoiding billions $ in damages from climate change induced sea level rise and extreme events. Studies by Depsky et al. (2022) and Tiggeloven et al. (2020) forecast significant financial impacts from sea level rise by 2100, emphasizing the economic benefits of infrastructure adaptation. The U.S. EPA (2017) and Fleming et al. (2018) further suggest that effective adaptation could save over $2.5 trillion annually in the U.S. alone. Implementing adaptation strategies typically involves different stages of progress - from awareness, assessment, planning, implementation, monitoring, to evaluation (Pörtner et al. 2022), yet many efforts are still in the planning phase. Shrestha, Howland and Chini (2023) suggest that the adaptation studies must encompass all time scales, from short to long term, that matches with infrastructure decision-making and planning time horizon rather than focusing solely on long-term climate projections. The review further indicates that there are a limited number of studies that consider multiple infrastructure systems and there is need for a more integrated approach to address the interconnected impacts of climate adaptation across coastal infrastructure systems.
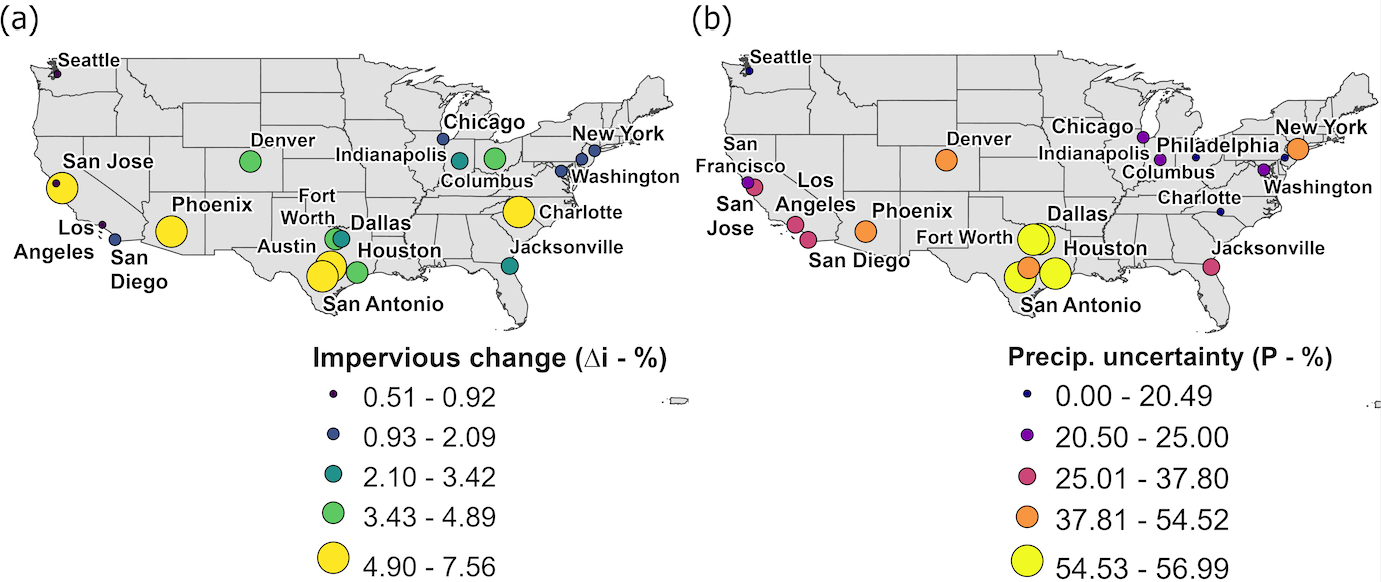
In the figure above, our study area in Phoenix, Arizona, is represented as experiencing a higher range of change in urban imperviousness, indicating substantial densification and sprawl, but it also shows a moderate range of uncerainty in precipitation estimates. Shrestha and Garcia (2023) evaluated the influence of such uncertainties by integrating the U.S. EPA SWMM model for urban catchments in Phoenix with a non-dominated sorting genetic algorithm (NSGA-II). The optimal configuration of green stormwater infrastructure (GSI), defined as the ideal selection of GSI types (e.g., bioretentions or green roofs), optimal distribution of GSI amounts throughout the urban catchment where it is most needed, and optimal sizing of GSI at the least capital cost investments, was determined. One of the results showed that uncertainties in precipitation in an urban environment have a higher impact than changes in urban imperviousness, although Phoenix has a relatively higher change in urban imperviousness but moderate precipitation uncertainty. Despite the multiple benefits, the adoption of green infrastructure at the catchment or city scale is limited. Understanding and quantifying such uncertainties and incorporating them into decision-making is important to advance large-scale adoption of green infrastructure.
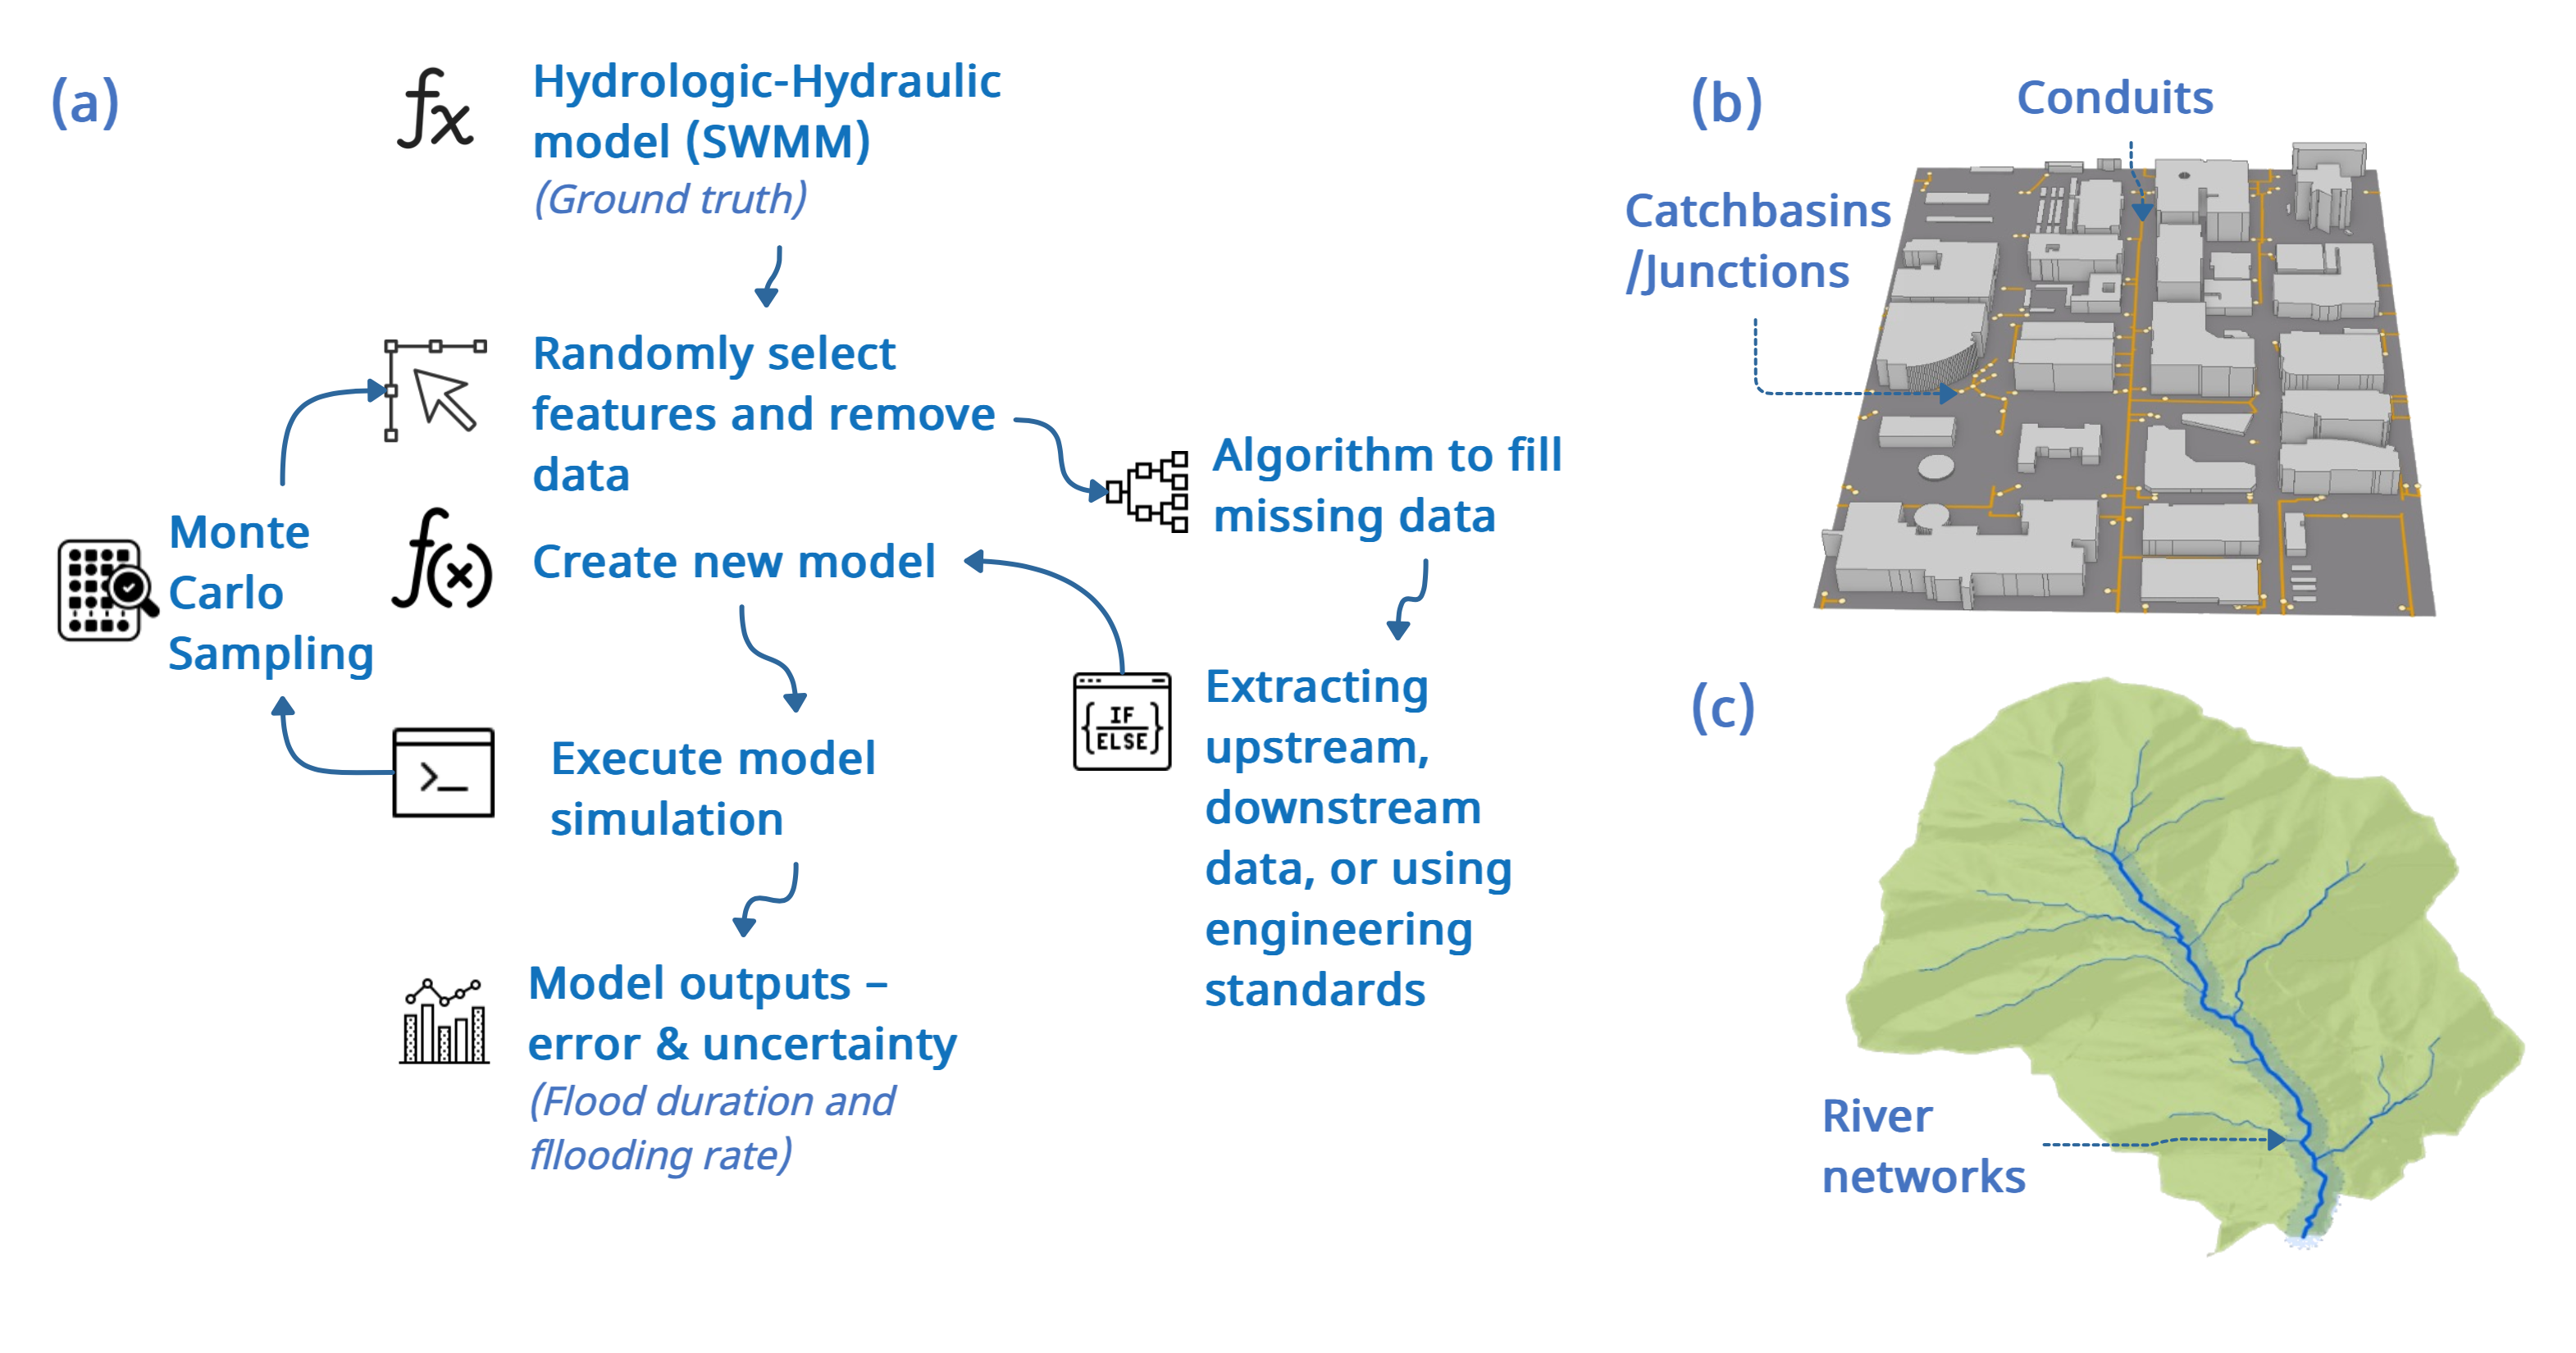
Infrastructure data components in hydrologic-hydraulic model includes all components of built stormwater systems, such as catch basins, manholes, conduits, detention and storage basins, drywells and outfalls. Unfortunately, these datasets are often incomplete or of poor quality and data collection efforts are resource intensive. Spatial data quality as defined by accuracy, current-ness, completeness, consistency (Fox et al., 1994), has been widely recognized to be of significant value in research and practice. This is especially true when electronic databases are produced, integrated and updated by multiple private and public sectors, and the reliance on secondary data sources increases for decision support tools. As the effect of data completeness on urban flood modeling has not been fully understood, Shrestha, Mascaro and Garcia (2022) aimed to understand the effect of stormwater infrastructure data completeness on urban flood modeling. Data completeness is conceptualized into feature completeness (which refers to the known presence and location of all stormwater infrastructure components) and attribute-value completeness (which refers to known attributes and values of each component). A Monte Carlo sampling algorithm was developed to assess how missing data and its location affect model performance, demonstrating the effectiveness of this approach in filling missing attribute data.
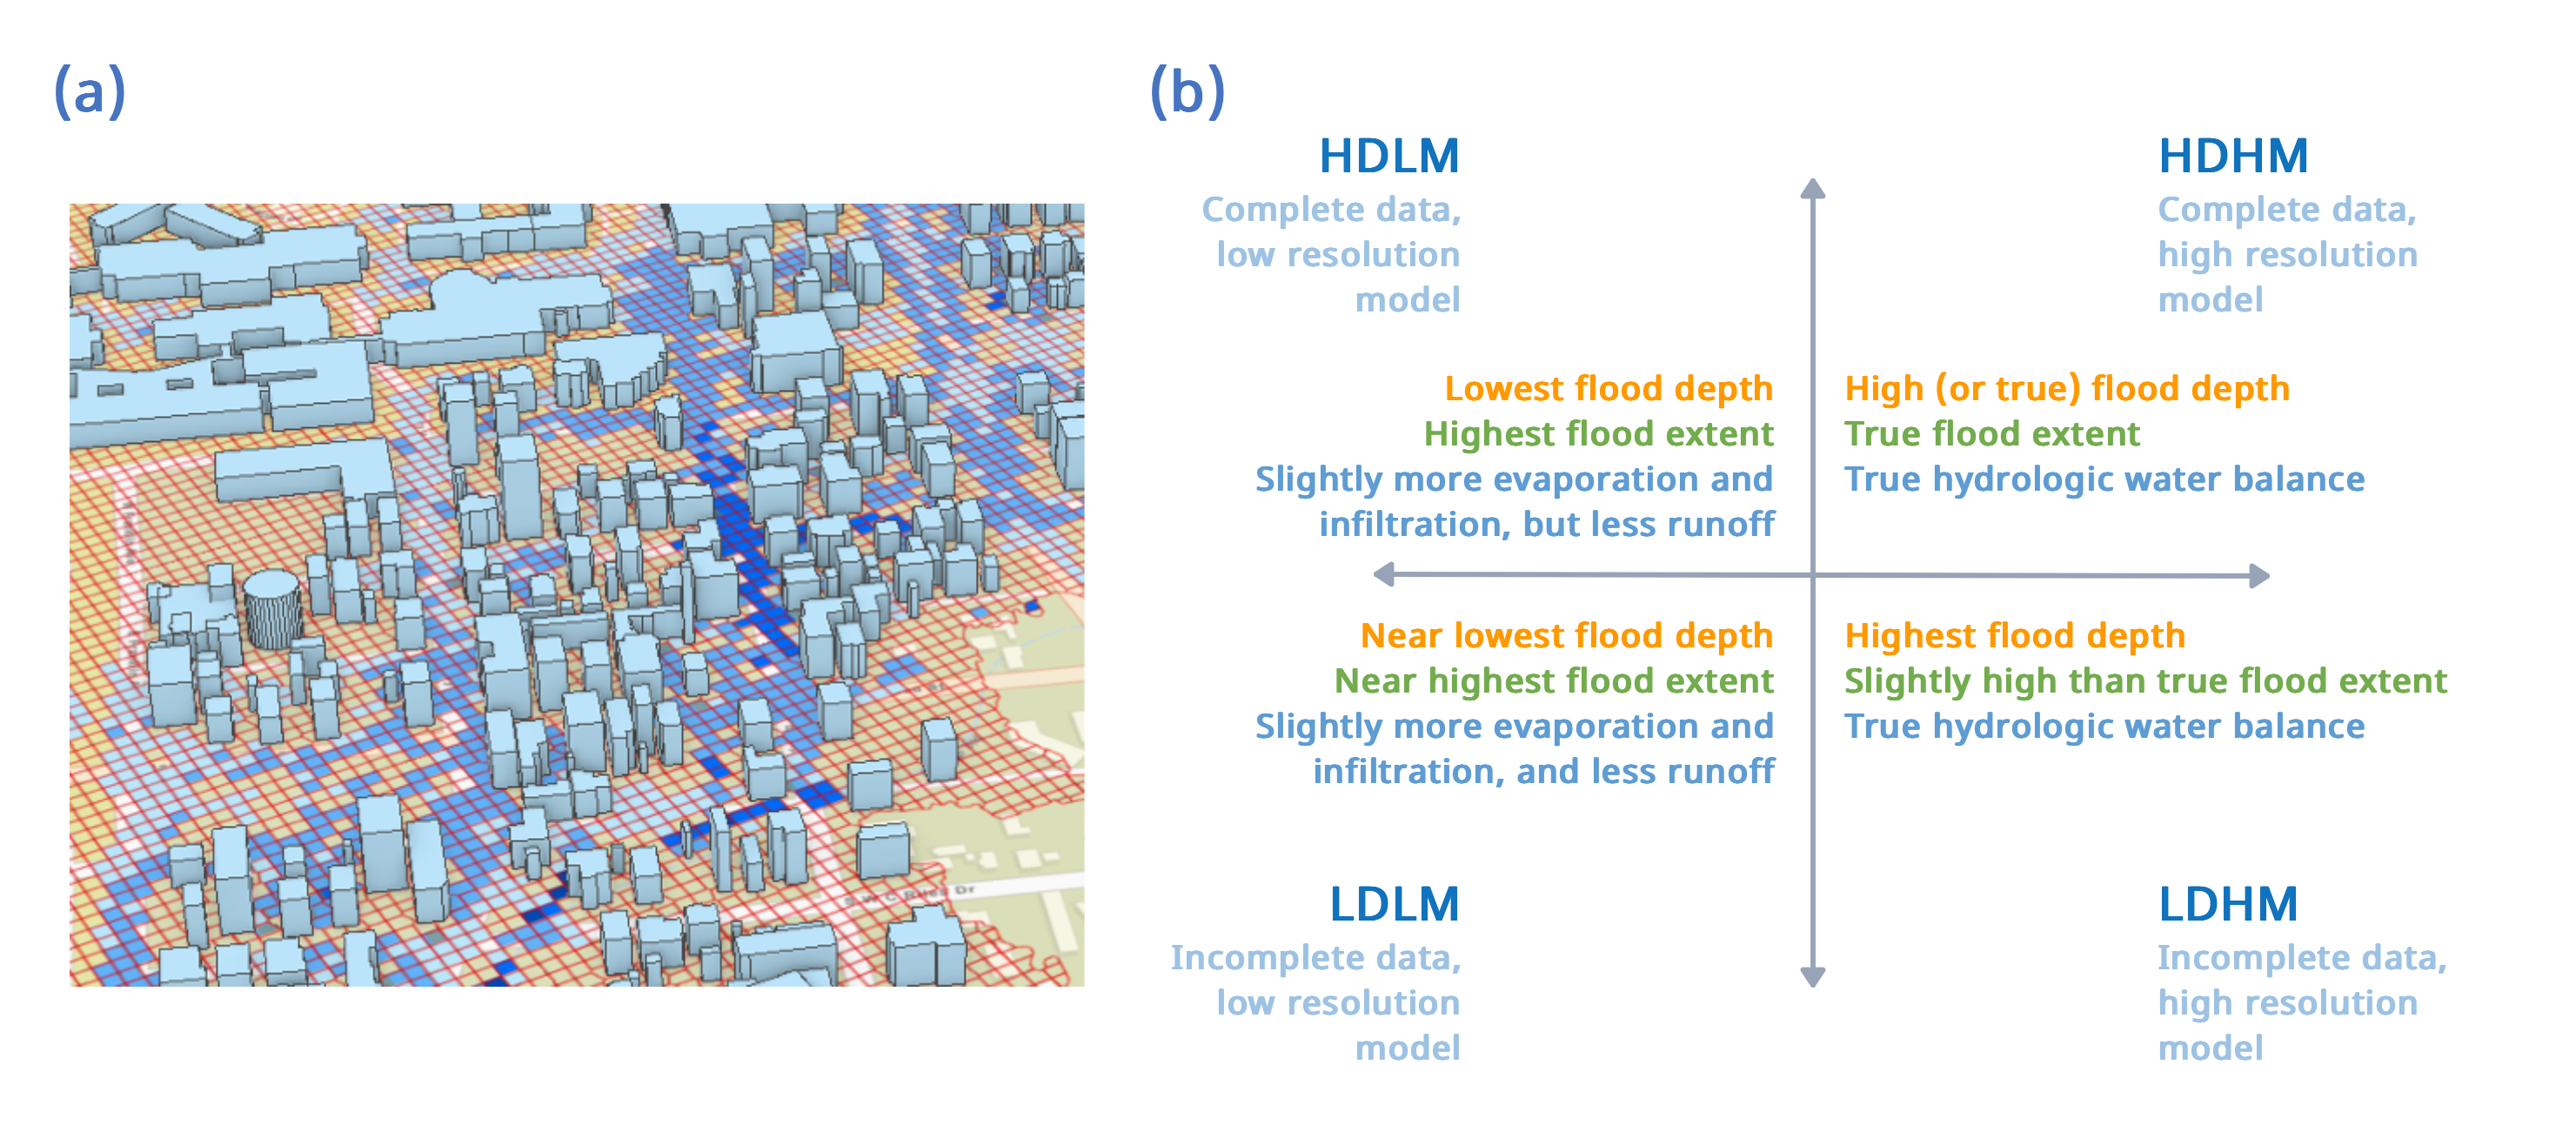
Shrestha, Mascaro and Garcia (2022) examined the influence of data completeness and model resolution on urban flood modeling by selectively sampling four SWMM-based 1D-2D models. We examined the effects of varying levels of feature data completeness (100% or 50% presence) and model resolution (using 0.3 m DEM and 9.7m DEM) on model performance. It's noted that the most commonly available DEM resolution from the USGS is approximately 1/3 arc-second (~10 m). The study found that models with higher resolution more accurately simulated the highest flood depths. In contrast, the highest flood extent and volume were simulated by the low-resolution models. This finding underscores the critical role of both data completeness and model resolution in generating accurate estimates of flood depth, extent, and volume. Such precision is crucial in urban flood estimation for assessing pedestrian and vehicle flood hazards, where accurate information on flood extent, volume, and depth is essential for effective flood risk management and planning.
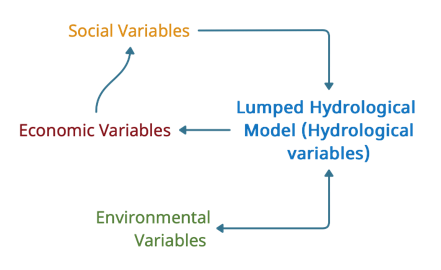
In coupled human-water systems, human societies and water systems influence each other in complex ways. This interaction becomes particularly complex when multiple actors manage water resources, such as in transboundary river basins, involving dynamic operations of reservoirs. In such systems, hydrological, social, environmental, and economic variables create feedback loops, leading to a dynamic system response. Capturing this behavior requires more than a hydrological model or analytical process alone. It necessitates a comprehensive understanding of the system's processes, integration of datasets from various disciplines, and mathematical formulation of these processes through collaborative effort. Shrestha et. al (2022) applied the theory of socio-hydrology to build a system dynamics model consisting of lumped hydrological model in the Columbia River watershed. This model was used to examine the dynamics of cooperation between the U.S. and Canada under the Columbia River Treaty, recognized as one of the most successful transboundary river treaties. The study evaluated how the robustness of this cooperative agreement might be affected by shift in equitable benefit sharing due to environmental change and regulation, and change in social preferences. The study found that institutional capacity plays an important role in long-term cooperation and that change in social preferences can impact cooperation dynamics. Applying such modeling framework, which integrates behavioral economics, can provide key insights to inform reservoir operation and water management policies.